
Get it? Jelly Bean... jumps... jumping bean... ah, forget it... my wife tells me my humour's always slightly 'off'.
Anyways, the latest distribution for the Android Platform is out and it's interesting.
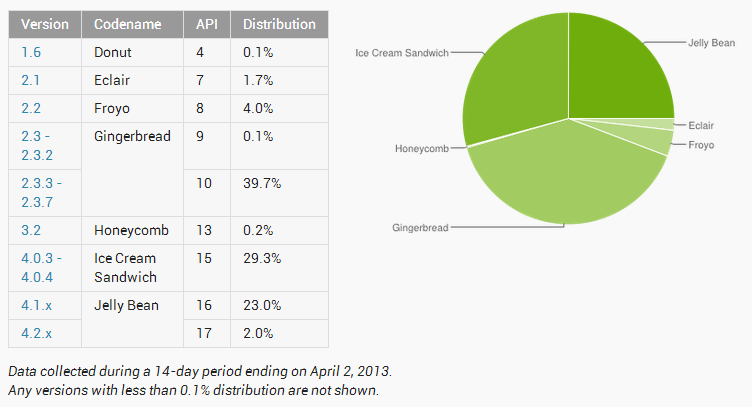
Immediately you look at it and are shocked by the recent 'jump' by Jelly Bean.
I'd have to look at the previous stats to see where it was before (Feb / Mar), but there's a reason for that 'jump'.
 The main difference between the last two iterations is that previously Google only measured you as a stat if you 'touched' a Google Service, now they're only counting if you use the Play Store.
Which makes more sense. Folks using the Play Store really are using Android. Those who are just using a phone that happens to have a Gmail button on it, might not be really 'experiencing' Android. And seeing that this distribution chart really is for the developers, that's the folk who really want to know who's using what version of Android so they can get their app from the Play Store.
That said, it might explain the jump.
Feb 13.6% -> March 16.5% -> April 25%
(that's over a 50% jump).
Then it begs the question, are users on Jelly Bean that much more 'active' than those who are not? Gingerbread was 45% - 44% - 39%, whereas ICS stayed about the same (29/28/29).
I'm keenly interested to hear if they can pull out the stats by country and see how Canada is fairing compared to the rest. What's your take?
Source: http://developer.android.com/about/dashboards/index.html
Anyways, the latest distribution for the Android Platform is out and it's interesting.
Immediately you look at it and are shocked by the recent 'jump' by Jelly Bean.
I'd have to look at the previous stats to see where it was before (Feb / Mar), but there's a reason for that 'jump'.
Which makes more sense. Folks using the Play Store really are using Android. Those who are just using a phone that happens to have a Gmail button on it, might not be really 'experiencing' Android. And seeing that this distribution chart really is for the developers, that's the folk who really want to know who's using what version of Android so they can get their app from the Play Store.
That said, it might explain the jump.
Feb 13.6% -> March 16.5% -> April 25%
(that's over a 50% jump).
Then it begs the question, are users on Jelly Bean that much more 'active' than those who are not? Gingerbread was 45% - 44% - 39%, whereas ICS stayed about the same (29/28/29).
I'm keenly interested to hear if they can pull out the stats by country and see how Canada is fairing compared to the rest. What's your take?
| Version | Codename | API | Distribution |
|---|---|---|---|
| 1.6 | Donut | 4 | 0.1% |
| 2.1 | Eclair | 7 | 1.7% |
| 2.2 | Froyo | 8 | 4.0% |
| 2.3 - 2.3.2 | Gingerbread | 9 | 0.1% |
| 2.3.3 - 2.3.7 | 10 | 39.7% | |
| 3.2 | Honeycomb | 13 | 0.2% |
| 4.0.3 - 4.0.4 | Ice Cream Sandwich | 15 | 29.3% |
| 4.1.x | Jelly Bean | 16 | 23.0% |
| 4.2.x | 17 | 2.0% |
Source: http://developer.android.com/about/dashboards/index.html
Comments
Post a Comment